Kennisbank
Real-Time Stats
The Home tab provides a general overview of the results of your latest mailing. Here you can set the time frame you prefer, choosing from the following reporting periods:
- Today;
- Last 7 days;
- Last 30 days;
- Last 3 months.
This page also displays your recipients’ interactions with your emails, including openings, clicks, unsubscribes, etc.
All statistics are updated in real time, enabling you to keep track of every change as it happens.
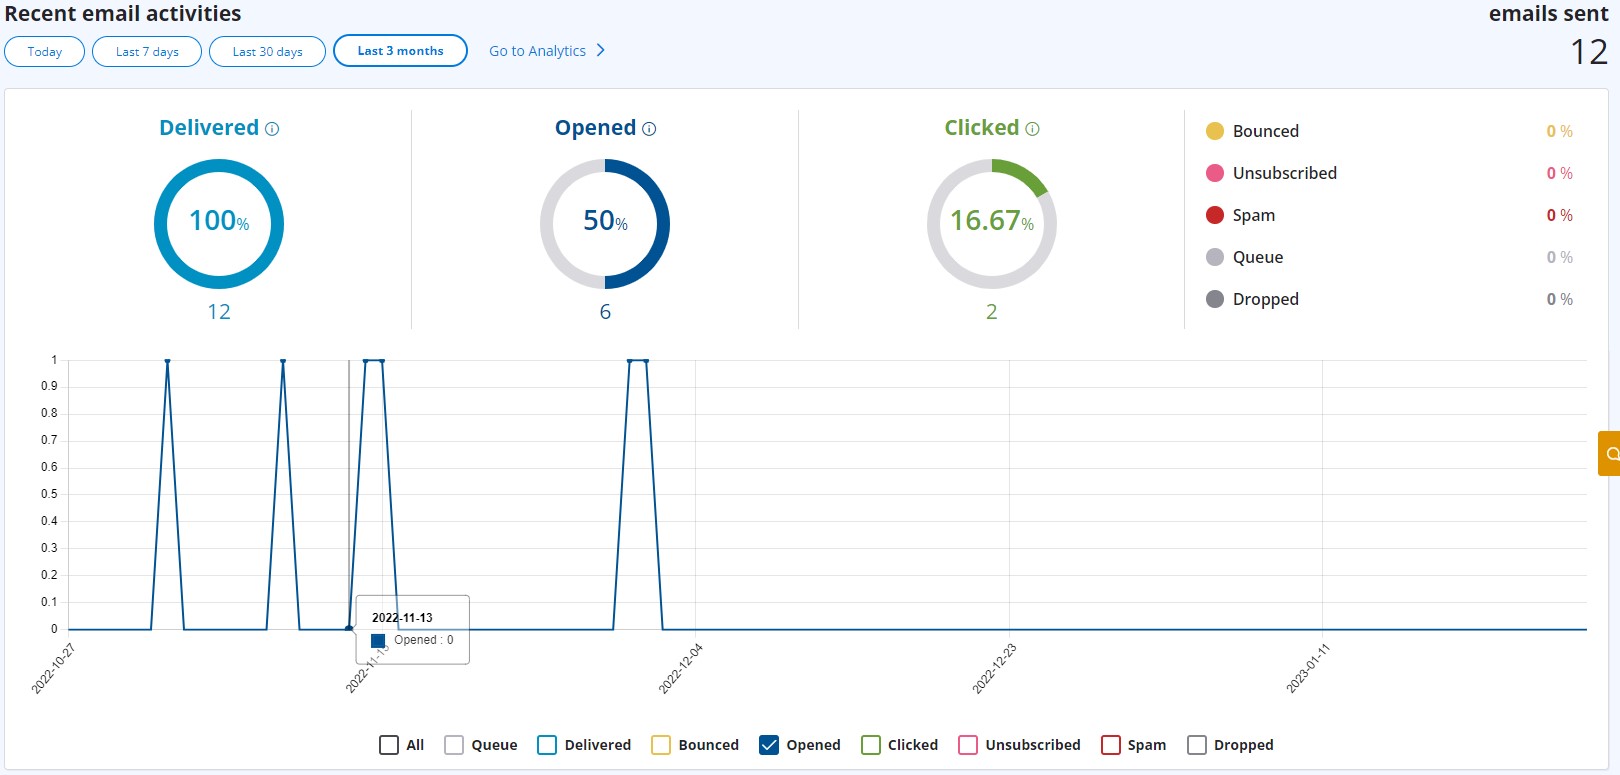
Example of the Home page’s chart with the latest email activities.
To see more detailed information, click Analytics from the side menu on the left.
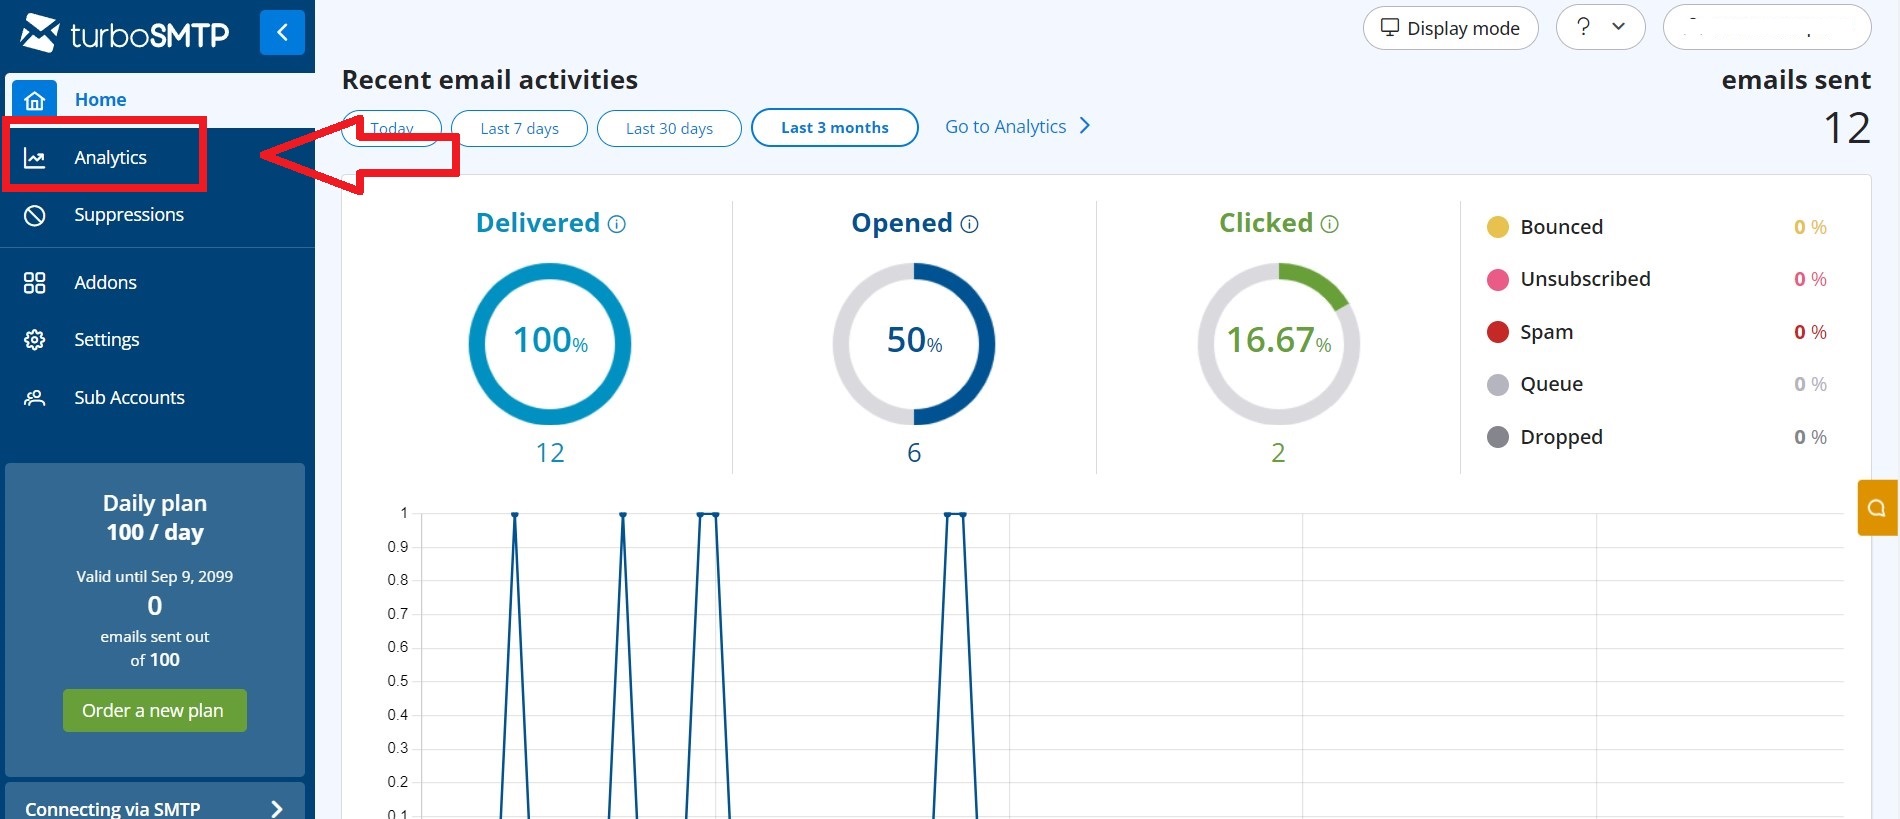
Tap the menu option Analytics from the side menu on the left
Now you can set the period you prefer by clicking the calendar, as shown below.
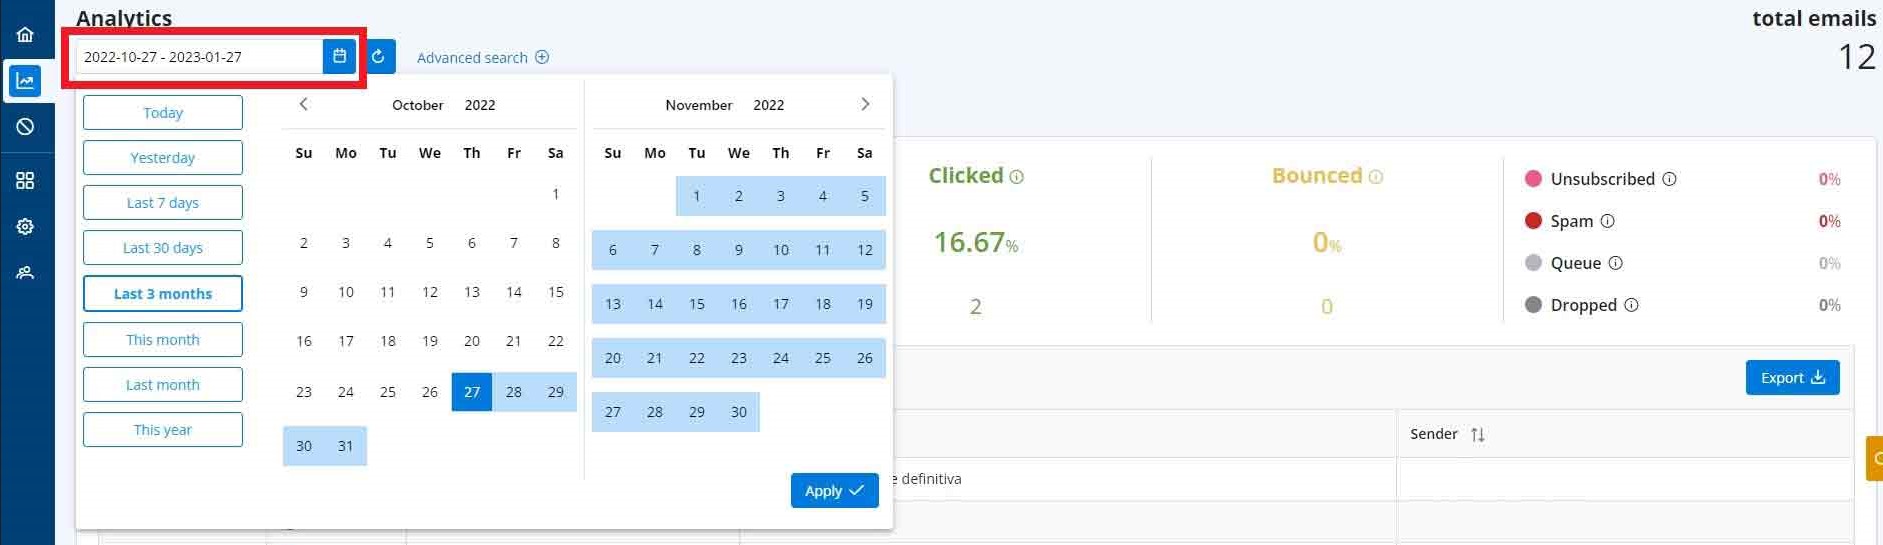
The Analytics page’s calendar for selecting a specific period.
Clicking the Charts tab lets you narrow down the metrics on an hourly, daily, weekly or monthly basis in your chosen time frame.
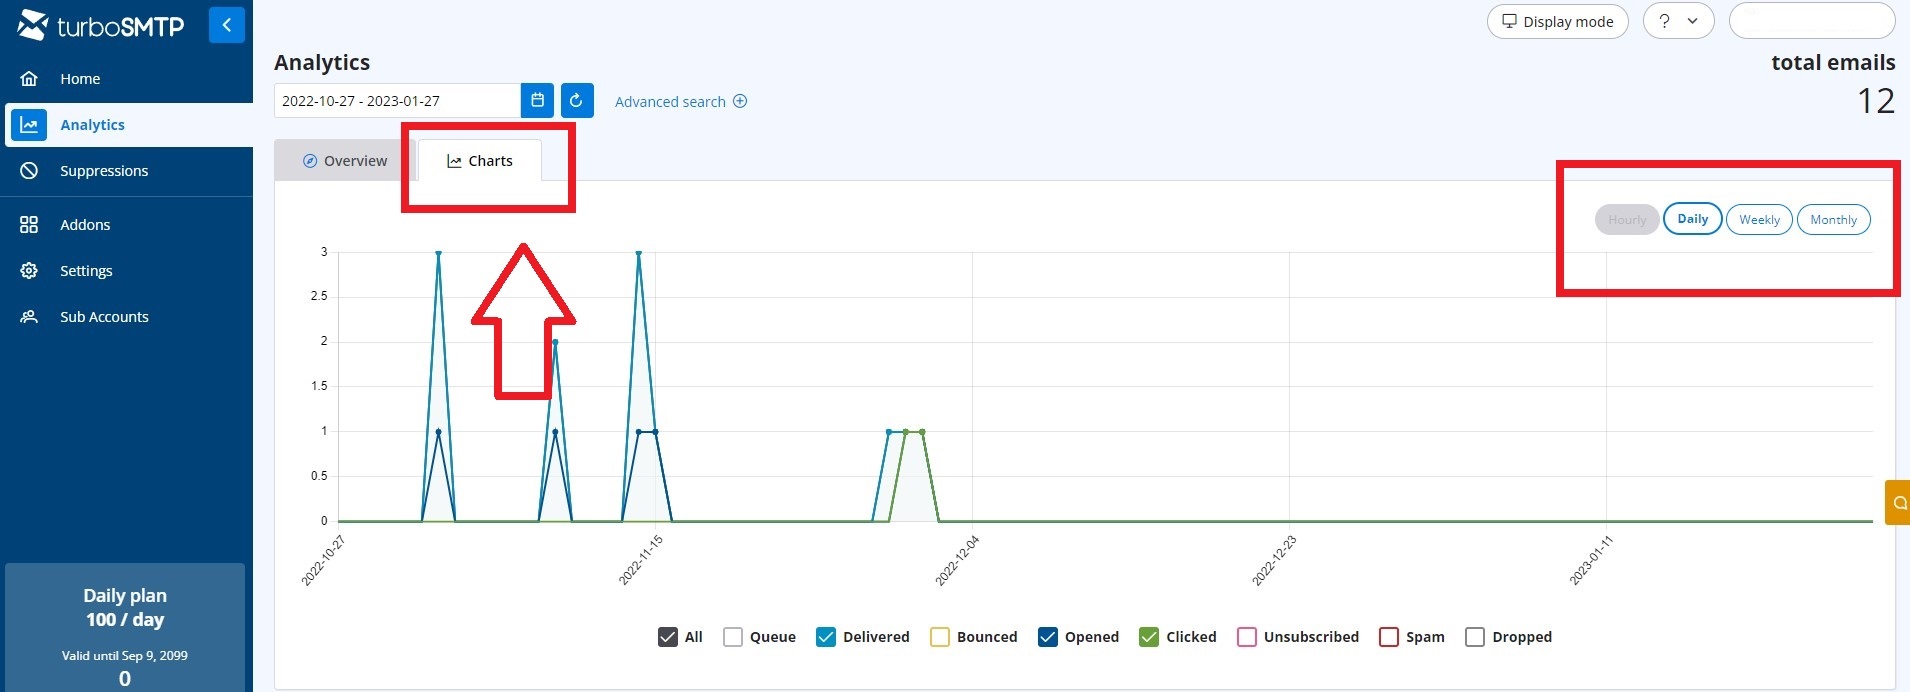
The data visualization by time criteria in the Charts tab.
To see more detailed statistics, click Advanced search. You’ll be able to filter your submissions using one or more metrics, such as clicks, spam, unsubscribes, etc.
You can also filter data based on:
- Subject: The subject line of the emails you wish to review.
- Sender: The sender of a set of emails.
- Recipient: The subscriber who received the emails.
- Domain: Where recipients receive their messages such as at gmail.com or outlook.it.
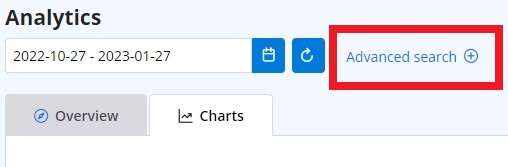
With the Advanced search, mailing results can be filtered by specific parameters.
The lines on the chart are highlighted in different colors representing the values tracked by turboSMTP:
All: The total number of sent emails managed by TurboSMTP.
Queue: Emails still on their way to the recipient's incoming server.
Delivered: The number of emails correctly delivered to recipients.
Opened: The number of delivered emails that have been opened. This essential information helps you understand whether your subject line is catchy enough to entice readers. The open rate can be used to measure the real interaction rate of your subscribers.
Clicked: The number of times a link in the email has been clicked. This is another vital metric that measures the effectiveness of your call to action.
Unsubscribed: The number of people who received the email but unsubscribed from your list during the selected period. If this number is too high, you might want to change your communication style.
Spam: The percentage of spam reports your message triggered based on the number of times your email has been labeled as junk.
Bounced: The number of emails that have been rejected because of wrong or nonexistent addresses.
Dropped: The number of emails dropped by outgoing servers because the recipient addresses are in one or more blacklists. This record is triggered by bounce, spam reports or unsubscriptions.
These metrics will be a huge help to understanding the efficiency of your email campaign, enabling you to check the progress of your messages in real time.
|
|

